What level of SLAs are reasonable for today's applications?
It is helpful to know the amount of downtime that each level of availability represents. The following table shows the amount of downtime expected for different levels of availability.
Level of availability
|
Downtime per year
|
90%
|
36.5 days
|
95%
|
18.25 days
|
99%
|
3.65 days
|
99.5%
|
43.8 hours
|
99.9%
|
8.76 hours
|
99.99%
|
50 minutes
|
99.999%
|
5 minutes
|
Industry
|
IT Service
|
Cost of Downtime (CoD) per Min
and per Hr
|
Financial
|
Brokerage Operations
|
$107,500/$6,450,000
|
Financial
|
Credit card/Sales authorization
|
$43,333/$2,600,000
|
Financial
|
ATM fees
|
$241/$14,500
|
Media
|
pay-per-view
|
$2,500/$150,000
|
Media
|
teleticket sales
|
$1,150/$69,000
|
Retail
|
Home shopping
|
$1,883/$113,000
|
Retail
|
Catalog sales
|
$1,500/$90,000
|
Transportation
|
Airline reservations
|
$1,483/$89,000
|
Transportation
|
Package shipping
|
$466/$28,000
|
Mean CoD/min
|
$17,784
|
*Downtime Cost per Hour for Various Industries (source Gartner Dataquest)
The above table shows that not all applications require the same level of availability. In fact, high availability can cost the business more than it returns!
Part of the job of availability management is to produce service and business views of availability. Those IT services that are most critical underpin what ITIL calls a Vital Business Function, VBF. Focusing on the IT services that underpin a VBF, the business can make an informed decision regarding importance, and thus the return on investment (ROI) calculation about availability. The issue of course is ‘cost to improve’ vs. ‘loss from downtime.’
The Impact of Outage:
- Loss of Staff Productivity = P x E x R x H
Where:
P = number of people affected
E = average percentage they are affected
R = average employee cost per hour
H = number of hours of outage
- · Loss of Revenue = (GR / TH) x I x H
Where:
GR = gross yearly revenue
TH = total yearly business hours
I = percentage impact
H = number of hours of downtime
- Damaged Reputation and Loyalty
- Regulatory and legal obligations
·
Yet even with the best intentions big IT shops also have significant outages:
http://www.itwire.com/business-it-news/security/51811-update-to-last-nights-commonwealth-bank-outage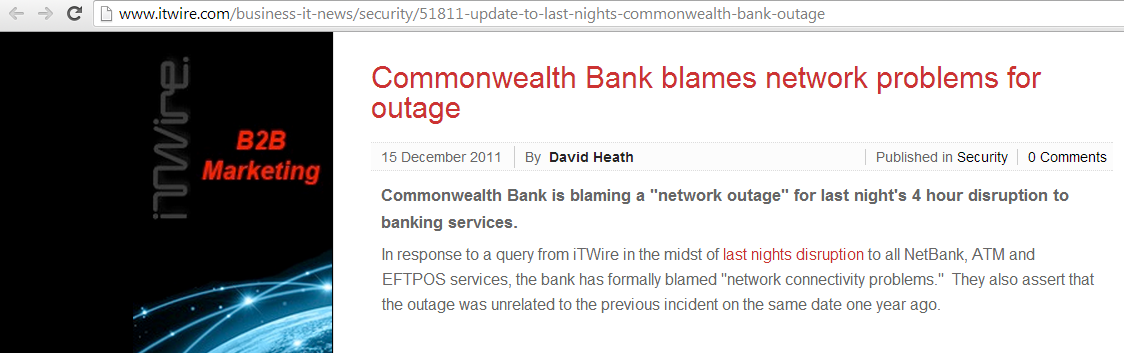
For major companies have outages, for more details see:
Cloud based applications can be engineered to have great availability. Cloud based applications typically have a much larger user base and are engineered to be highly available with servers and data in geographically dispersed data centres. Typically large cloud environments have greater budgets, more resources and better engineering staff due to their massive scale to architect solutions that offer better availability than typical enterprise IT shop.
For example one of the most popular cloud apps Gmail reports 99.983% availability for the year 2012:
" In 2012, Gmail achieved 99.983% availability while at the same time adding dozens of new features. This translates to an average of just over seven minutes of service disruption per month over the last year, and most users experienced no disruption at all. "
Yet how do enterprise IT apps compare to other services? When we compare IT to other services like Sydney public transport which achieves only 93.1% on time and leaves thousands of workers regularly late then IT system which provide 99.9% availability for a whole year are very good in comparison.

*On-time running includes a train that arrives at Central Station on-time but has skipped timetabled stops along the way, leaving customers waiting on platforms,
No comments:
Post a Comment