https://communities.vmware.com/docs/DOC-11812 esxtop
https://labs.vmware.com/flings/visualesxtop visaul esxtop
http://blogs.totalcaos.com/understanding-rdy-cpu-ready/
http://www.boche.net/blog/index.php/2010/10/21/cpu-ready-to-rdy-conversion/
http://www.davidklee.net/articles/sql-server-articles/cpu-overcommitment-and-its-impact-on-sql-server-performance-on-vmware/
A brief explanation of why the use of fewer vCPUs is better than more vCPUs:
https://www.vmsources.com/images/docs/CPU_Overcommittment_inVMware_vSphere_5.pdf
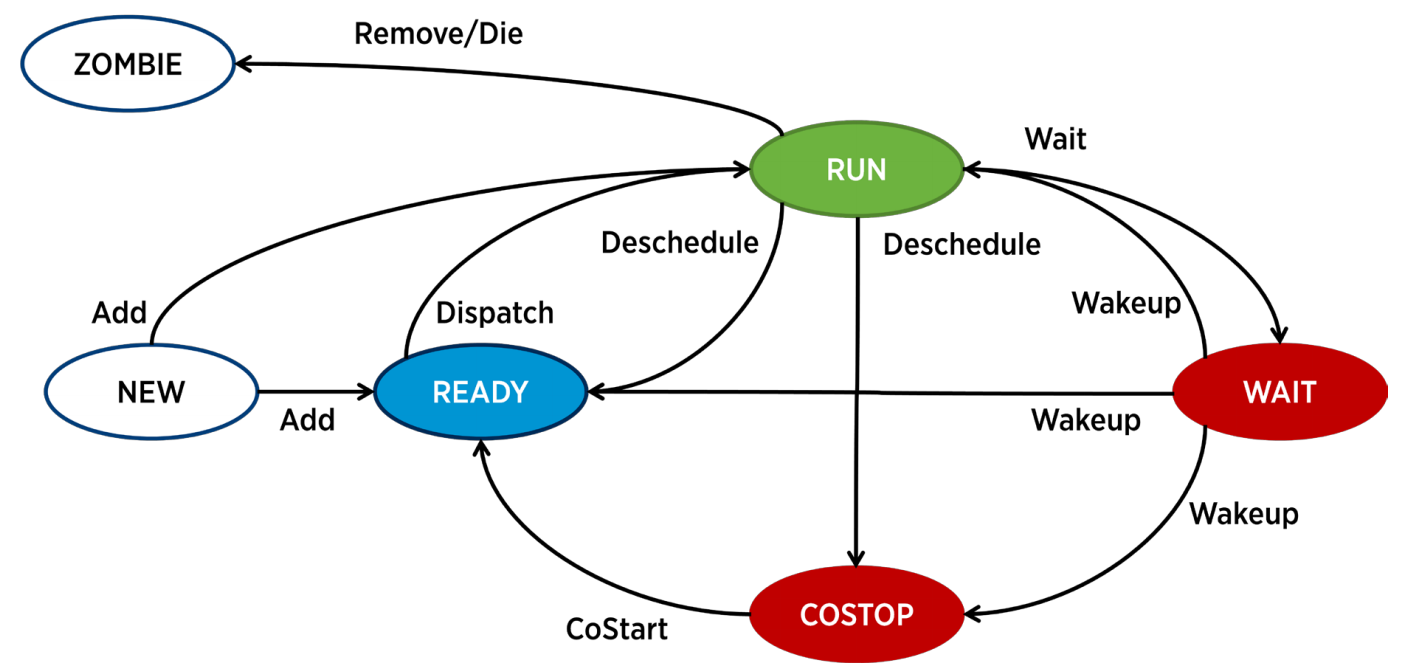
CPU Scheduler:
vCenter defines the default rollup periods, with data interval, as the following:
- Real-Time: 20s interval
- Daily: 5m interval
- Weekly: 30m interval
- Monthly: 2h interval
Real-Time:

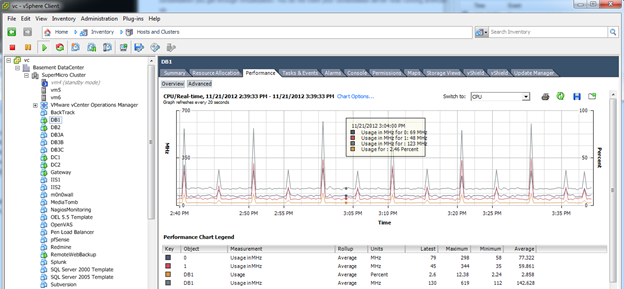
In vSphere Client see performance for VM or for host:
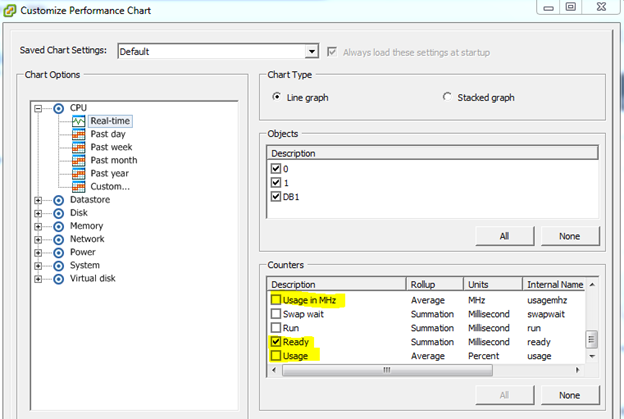
To display the CPU Ready metric, select Chart Options:
In esxtop:
-
%RDY – %RDY or CPU Ready percentage is the metric that describes the amount of time a virtual machine waits in the queue in a ready-to-run state before it can be scheduled on a pCPU. The lower %RDY metric the better and the generally acceptable threshold is around 10% but aim for 5% or less.
-
%CSTP - it is a measure of the percentage of time a vCPU in an SMP virtual machine is “stopped” from executing, so that another vCPU in the same virtual machine could be run to “catch-up” and make sure the skew between the two virtual processors doesn’t grow too large. In most cases a high %CSTP value is a good indicator that the number of vCPUs on a VM has been over-provisioned. In some cases a high %CSTP value can also be seen during VM snapshot activities.
Focusing on a VM in the vSphere Client, you’ll find a performance metric called CPU Ready. This is the vSphere Client metric which tells us how much time the guest VM is waiting for its share of CPU execution from the host just as %RDY did in ESXTOP. But when you look at the statistics, you’ll notice a difference. %RDY in ESXTOP provides us with metrics in a % format. CPU Ready in the vSphere Client provides metrics in a millisecond summation format. 10% RDY (per each vCPU) is a threshold to watch out for. How does a % value from ESXTOP translate to a millisecond value in the vSphere Client?
There’s a little math involved. To convert the vSphere Client CPU Ready metric to the ESXTOP %RDY metric, you divide the CPU Ready metric by the rollup summation (which are both values in milliseconds). What does this mean? Say for instance you’re looking at the overall CPU Ready value for a VM in Real-time. Real-time is refreshed every 20 seconds and represents a rollup of values over a 20 second period (that’s 20,000 milliseconds). Therefore…
-
If the CPU Ready value for the VM is, say 500 milliseconds, we divide 500 milliseconds by 20,000 milliseconds and arrive at nearly 3% RDY. Hardly anything to be concerned about.
-
If the CPU Ready time were 7,500, we divide 7,500 milliseconds by 20,000 milliseconds and arrive at 37.5% RDY or trouble assuming a 1 vCPU VM.
What do I mean above by 1 vCPU VM? The overall VM CPU Ready metric is the aggregate total of CPU Ready for each vCPU. This should sound familiar – if you know how %RDY works in ESXTOP, then you’re armed with the knowledge needed to understand what I’m explaining. The %RDY value in ESXTOP is the aggregate total of CPU Ready for each vCPU. In other words, if you saw a 20% RDY value in ESXTOP for a 4 vCPU VM, the actual %RDY for each vCPU is 5% which is well under the 10% threshold we generally watch for. In the vSphere Client, not only can you look at the overall aggregate CPU Ready for a particular VM (which should be divided by the number of assigned vCPUs for the VM), but you can also look at the CPU Ready values for the individual vCPUs themselves. It is the per CPU Ready value which should be compared with published and commonly known thresholds. When looking at Ready values, it’s important to interpret the data correctly in order to compare the right data to thresholds.
So what leads to elevated CPU Ready values?:
While it is quite straight forward to determine the cause of high CPU utilization finding the root cause of high CPU Ready values can be a little bit more tricky. Some of the contributing factors are:
-
CPU Over-subscription is by far one of the most common causes that leads to high %RDY. Oversubscribing the number of pCPUs on the host with too many vCPUs can make it more difficult for the VMkernel scheduler to queue up processes for execution without effecting performance.
-
There is no prescribed number that determines what constitutes too much oversubscription. This is purely a “it depends” answer. Some rough and ready guidelines suggest that in most cases consolidation ratios of 1:1 – 1:3 (pCPU to vCPU) do not cause any major issues. Consolidating at a ratio of any more than 1:3 may begin to cause performance degradation.
-
CPU Limits: Putting limits on virtual machine CPU goes against VMware best practice and should be used sparingly and only under special circumstances. Placing limits on CPU allocations on a virtual machine will cause an increase in %RDY. esxtop exposes a metric %MLMTD that describes the percentage of time the VM is ready to run but is not scheduled as it would violate the CPU limits imposed.
-
%MLMTD is added to %RDY time, and can lead to increased %RDY values being reported
-
CPU Affinity: implementing CPU Affinity takes control away from the VMKernel scheduler in determining where processes should be executed across all available pCPUs. In the even that multiple virtual machines are locked to a pCPU using CPU Affinity a situation similar to significant pCPU over-subscription is created, leading to increased %RDY times.
-
Fault Tolerance (FT): In some extreme scenarios if the FT network between the primary and protected virtual machines cannot keep up with the volume of changes, the primary virtual machine is throttled back. This can be seen through increased %MLMTD values and consequently increased %RDY values through esxtop.
-
Oversized VMs: Deploying oversized VMs that span multiple NUMA nodes can lead to instances where a vCPU may need to retrieve memory blocks stored on another NUMA node. This will cause a CPU WAIT to be raised, while the memory block is retrieved. This has an effect of increasing latency and degrading performance on the virtual machine in question. However this has a flow on effect where other VMs on the same physical host will experience elevated %RDY values due to increased number of CPU WAIT requests being raised.
-
As far as possible, try and size the virtual machine such that it fits within its NUMA node, both for vCPUs and Memory allocation.
How do I fix high CPU Ready issues?
There are a few things that can be looked at to reduce CPU Ready values
-
Pro-actively “right size” your virtual guests and ESXi hosts: I cannot begin to stress the importance of right sizing the virtual machines running on your infrastructure. Yes you can scale up to 32 vCPUs and 2 TB Memory with vSphere 5.1 but bigger does not always mean better! Start small and be proactive with monitoring the vCPU and vMemory utilization on both the virtual guests and the underlying physical infrastructure. Increase (or decrease) resources allocated to the guests based on past trends. While sizing the virtual guests, try and stay within NUMA boundaries to reduce latency and CPU WAIT times.
-
Pro-actively manage over-subscription: Monitor the current pCPU to vCPU over-subscription values. Decide what over-subscription the organization is comfortable with and look to deploy new hosts or clusters on a “as needed” basis. Develop strategies to protect mission critical systems by segregating workloads on to clusters with lower subscription ratios.
-
Avoid using CPU Limits: not only does this go against VMware best practice it also ends up becoming a nightmare to manage. Use resource pools instead.
-
Avoid using CPU Affinity: let the VMKernel scheduler decide what’s best. That’s what it is built to do. Leverage the flexibility that the vSphere DRS offers in managing workload
-
Understand what vSphere DRS can and cannot do. Monitor vSphere DRS initiated vMotions to ensure DRS does not cause CPU Ready issues.
-
Use VMware best practice storage and network design principles so VMs do not spend too much time in the CPU WAIT state due to to storage/network latency issues.
Useful tools to calculate CPU Ready %:
https://virtualpad.wordpress.com/2015/12/17/cpu-ready-quick-table/
Based on: https://kb.vmware.com/s/article/2002181
DRS considers CPU ready to balance out the virtual infrastructure:
In esxtop:
- %RDY – %RDY or CPU Ready percentage is the metric that describes the amount of time a virtual machine waits in the queue in a ready-to-run state before it can be scheduled on a pCPU. The lower %RDY metric the better and the generally acceptable threshold is around 10% but aim for 5% or less.
- %CSTP - it is a measure of the percentage of time a vCPU in an SMP virtual machine is “stopped” from executing, so that another vCPU in the same virtual machine could be run to “catch-up” and make sure the skew between the two virtual processors doesn’t grow too large. In most cases a high %CSTP value is a good indicator that the number of vCPUs on a VM has been over-provisioned. In some cases a high %CSTP value can also be seen during VM snapshot activities.
Focusing on a VM in the vSphere Client, you’ll find a performance metric called CPU Ready. This is the vSphere Client metric which tells us how much time the guest VM is waiting for its share of CPU execution from the host just as %RDY did in ESXTOP. But when you look at the statistics, you’ll notice a difference. %RDY in ESXTOP provides us with metrics in a % format. CPU Ready in the vSphere Client provides metrics in a millisecond summation format. 10% RDY (per each vCPU) is a threshold to watch out for. How does a % value from ESXTOP translate to a millisecond value in the vSphere Client?
There’s a little math involved. To convert the vSphere Client CPU Ready metric to the ESXTOP %RDY metric, you divide the CPU Ready metric by the rollup summation (which are both values in milliseconds). What does this mean? Say for instance you’re looking at the overall CPU Ready value for a VM in Real-time. Real-time is refreshed every 20 seconds and represents a rollup of values over a 20 second period (that’s 20,000 milliseconds). Therefore…
- If the CPU Ready value for the VM is, say 500 milliseconds, we divide 500 milliseconds by 20,000 milliseconds and arrive at nearly 3% RDY. Hardly anything to be concerned about.
- If the CPU Ready time were 7,500, we divide 7,500 milliseconds by 20,000 milliseconds and arrive at 37.5% RDY or trouble assuming a 1 vCPU VM.
What do I mean above by 1 vCPU VM? The overall VM CPU Ready metric is the aggregate total of CPU Ready for each vCPU. This should sound familiar – if you know how %RDY works in ESXTOP, then you’re armed with the knowledge needed to understand what I’m explaining. The %RDY value in ESXTOP is the aggregate total of CPU Ready for each vCPU. In other words, if you saw a 20% RDY value in ESXTOP for a 4 vCPU VM, the actual %RDY for each vCPU is 5% which is well under the 10% threshold we generally watch for. In the vSphere Client, not only can you look at the overall aggregate CPU Ready for a particular VM (which should be divided by the number of assigned vCPUs for the VM), but you can also look at the CPU Ready values for the individual vCPUs themselves. It is the per CPU Ready value which should be compared with published and commonly known thresholds. When looking at Ready values, it’s important to interpret the data correctly in order to compare the right data to thresholds.
So what leads to elevated CPU Ready values?:
While it is quite straight forward to determine the cause of high CPU utilization finding the root cause of high CPU Ready values can be a little bit more tricky. Some of the contributing factors are:
- CPU Over-subscription is by far one of the most common causes that leads to high %RDY. Oversubscribing the number of pCPUs on the host with too many vCPUs can make it more difficult for the VMkernel scheduler to queue up processes for execution without effecting performance.
- There is no prescribed number that determines what constitutes too much oversubscription. This is purely a “it depends” answer. Some rough and ready guidelines suggest that in most cases consolidation ratios of 1:1 – 1:3 (pCPU to vCPU) do not cause any major issues. Consolidating at a ratio of any more than 1:3 may begin to cause performance degradation.
- CPU Limits: Putting limits on virtual machine CPU goes against VMware best practice and should be used sparingly and only under special circumstances. Placing limits on CPU allocations on a virtual machine will cause an increase in %RDY. esxtop exposes a metric %MLMTD that describes the percentage of time the VM is ready to run but is not scheduled as it would violate the CPU limits imposed.
- %MLMTD is added to %RDY time, and can lead to increased %RDY values being reported
- CPU Affinity: implementing CPU Affinity takes control away from the VMKernel scheduler in determining where processes should be executed across all available pCPUs. In the even that multiple virtual machines are locked to a pCPU using CPU Affinity a situation similar to significant pCPU over-subscription is created, leading to increased %RDY times.
- Fault Tolerance (FT): In some extreme scenarios if the FT network between the primary and protected virtual machines cannot keep up with the volume of changes, the primary virtual machine is throttled back. This can be seen through increased %MLMTD values and consequently increased %RDY values through esxtop.
- Oversized VMs: Deploying oversized VMs that span multiple NUMA nodes can lead to instances where a vCPU may need to retrieve memory blocks stored on another NUMA node. This will cause a CPU WAIT to be raised, while the memory block is retrieved. This has an effect of increasing latency and degrading performance on the virtual machine in question. However this has a flow on effect where other VMs on the same physical host will experience elevated %RDY values due to increased number of CPU WAIT requests being raised.
- As far as possible, try and size the virtual machine such that it fits within its NUMA node, both for vCPUs and Memory allocation.
How do I fix high CPU Ready issues?
There are a few things that can be looked at to reduce CPU Ready values
- Pro-actively “right size” your virtual guests and ESXi hosts: I cannot begin to stress the importance of right sizing the virtual machines running on your infrastructure. Yes you can scale up to 32 vCPUs and 2 TB Memory with vSphere 5.1 but bigger does not always mean better! Start small and be proactive with monitoring the vCPU and vMemory utilization on both the virtual guests and the underlying physical infrastructure. Increase (or decrease) resources allocated to the guests based on past trends. While sizing the virtual guests, try and stay within NUMA boundaries to reduce latency and CPU WAIT times.
- Pro-actively manage over-subscription: Monitor the current pCPU to vCPU over-subscription values. Decide what over-subscription the organization is comfortable with and look to deploy new hosts or clusters on a “as needed” basis. Develop strategies to protect mission critical systems by segregating workloads on to clusters with lower subscription ratios.
- Avoid using CPU Limits: not only does this go against VMware best practice it also ends up becoming a nightmare to manage. Use resource pools instead.
- Avoid using CPU Affinity: let the VMKernel scheduler decide what’s best. That’s what it is built to do. Leverage the flexibility that the vSphere DRS offers in managing workload
- Understand what vSphere DRS can and cannot do. Monitor vSphere DRS initiated vMotions to ensure DRS does not cause CPU Ready issues.
- Use VMware best practice storage and network design principles so VMs do not spend too much time in the CPU WAIT state due to to storage/network latency issues.
Useful tools to calculate CPU Ready %:
https://virtualpad.wordpress.com/2015/12/17/cpu-ready-quick-table/
Based on: https://kb.vmware.com/s/article/2002181
DRS considers CPU ready to balance out the virtual infrastructure:
No comments:
Post a Comment