Sydney House Prices:
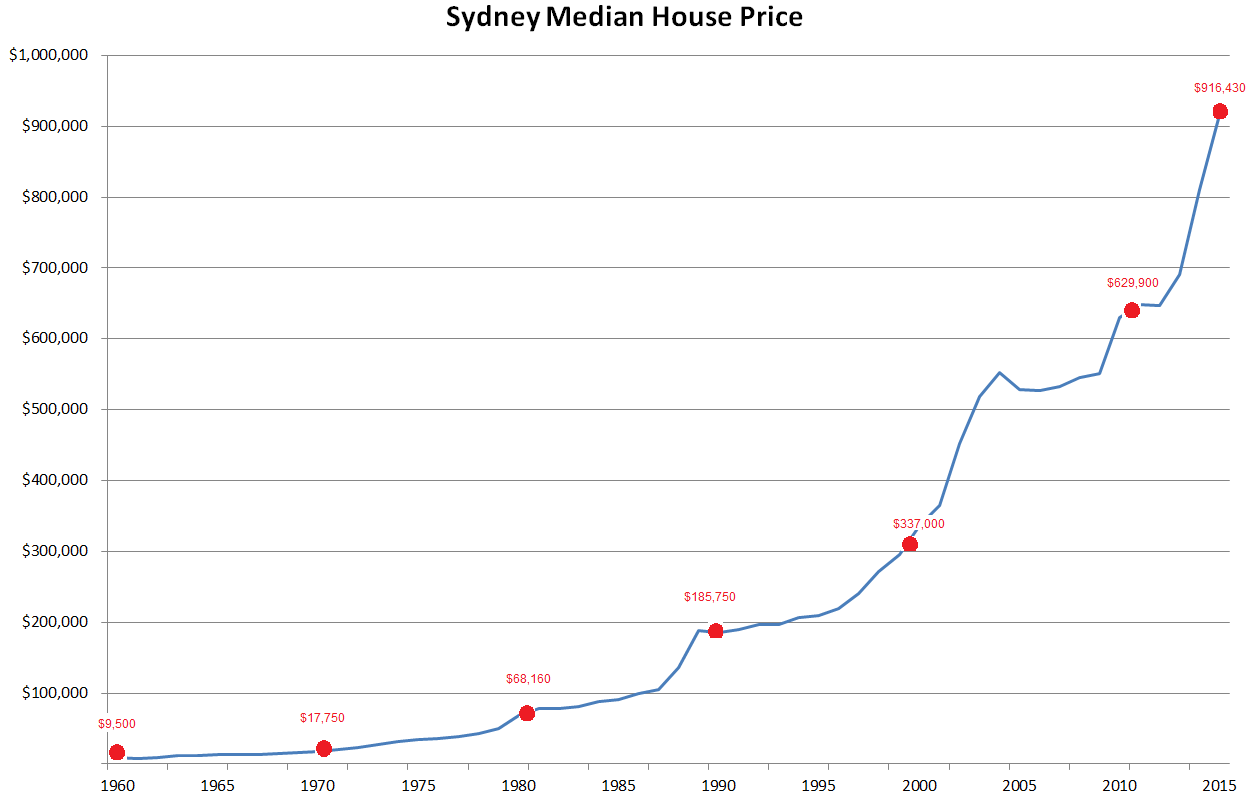
http://www.apialliance.com.au/articles/Long%20Term%20Housing%20Prices%20in%20Australia%20-%20Stapleton%20UNSW.pdf (1880 - 2005 p58)
http://www.macrobusiness.com.au/2012/10/qbelmi-and-bis-houses-to-the-moon/ (1996 - 2012)
http://www.qbelmi.com/Uploads/Documents/82c65c49-d7b0-47f1-8c7e-1db1845f7703.pdf (2006 - 2014)
https://www.domain.com.au/news/domain-property-reports/
Average weekly (male) earnings based on NSW ABS data:
http://www.abs.gov.au/ausstats/abs@.nsf/mf/6302.0

Inflation: http://www.rba.gov.au/statistics/tables/index.html

Home Loan Interest Rates (F05): http://www.rba.gov.au/statistics/tables/index.html

Private Dwelling Approvals: http://www.rba.gov.au/statistics/tables/index.html

Immigaration: https://www.immi.gov.au/media/fact-sheets/02key.htm

(a)(b)%20-%20Australia.GIF)
Housing approvals:
http://www.abs.gov.au/AUSSTATS/abs@.nsf/Lookup/8731.0Main+Features1Dec%202016?OpenDocument


First Home Buyers vs Investors:
Most people don't consider the huge effort required to repay the massive home loan as long as prices keep rising even though we are experiencing flat economic/salary growth. The trouble with ponzi schemes is you need an increasing number of new buyers both willing and able to pay more for the same assets.
http://www.macrobusiness.com.au/2012/10/qbelmi-and-bis-houses-to-the-moon/ (1996 - 2012)
http://www.qbelmi.com/Uploads/Documents/82c65c49-d7b0-47f1-8c7e-1db1845f7703.pdf (2006 - 2014)
https://www.domain.com.au/news/domain-property-reports/
Average weekly (male) earnings based on NSW ABS data:
http://www.abs.gov.au/ausstats/abs@.nsf/mf/6302.0
Inflation: http://www.rba.gov.au/statistics/tables/index.html
Home Loan Interest Rates (F05): http://www.rba.gov.au/statistics/tables/index.html
Private Dwelling Approvals: http://www.rba.gov.au/statistics/tables/index.html
Immigaration: https://www.immi.gov.au/media/fact-sheets/02key.htm
Housing approvals:
http://www.abs.gov.au/AUSSTATS/abs@.nsf/Lookup/8731.0Main+Features1Dec%202016?OpenDocument
First Home Buyers vs Investors:
Most people don't consider the huge effort required to repay the massive home loan as long as prices keep rising even though we are experiencing flat economic/salary growth. The trouble with ponzi schemes is you need an increasing number of new buyers both willing and able to pay more for the same assets.
Excel spreadsheet of all data here
Update 22/4/2017 - House prices are booming yet wages are struggling:

Property prices keep rising, Sydney house price rose 19.65% during last year:
https://www.corelogic.com.au/research/monthly-indices.html
Update 22/4/2017 - House prices are booming yet wages are struggling:
Property prices keep rising, Sydney house price rose 19.65% during last year:
https://www.corelogic.com.au/research/monthly-indices.html
No comments:
Post a Comment