Per Capita Spending:

The SIPRI Military Expenditure Database contains consistent time series on the military spending of 171 countries since 1988, and of NATO member states from 1949 or from when they joined NATO.
http://www.sipri.org/research/armaments/milex/milex_database
http://www.sipri.org/research/armaments/milex/milex_database/milex-data-1988-2014


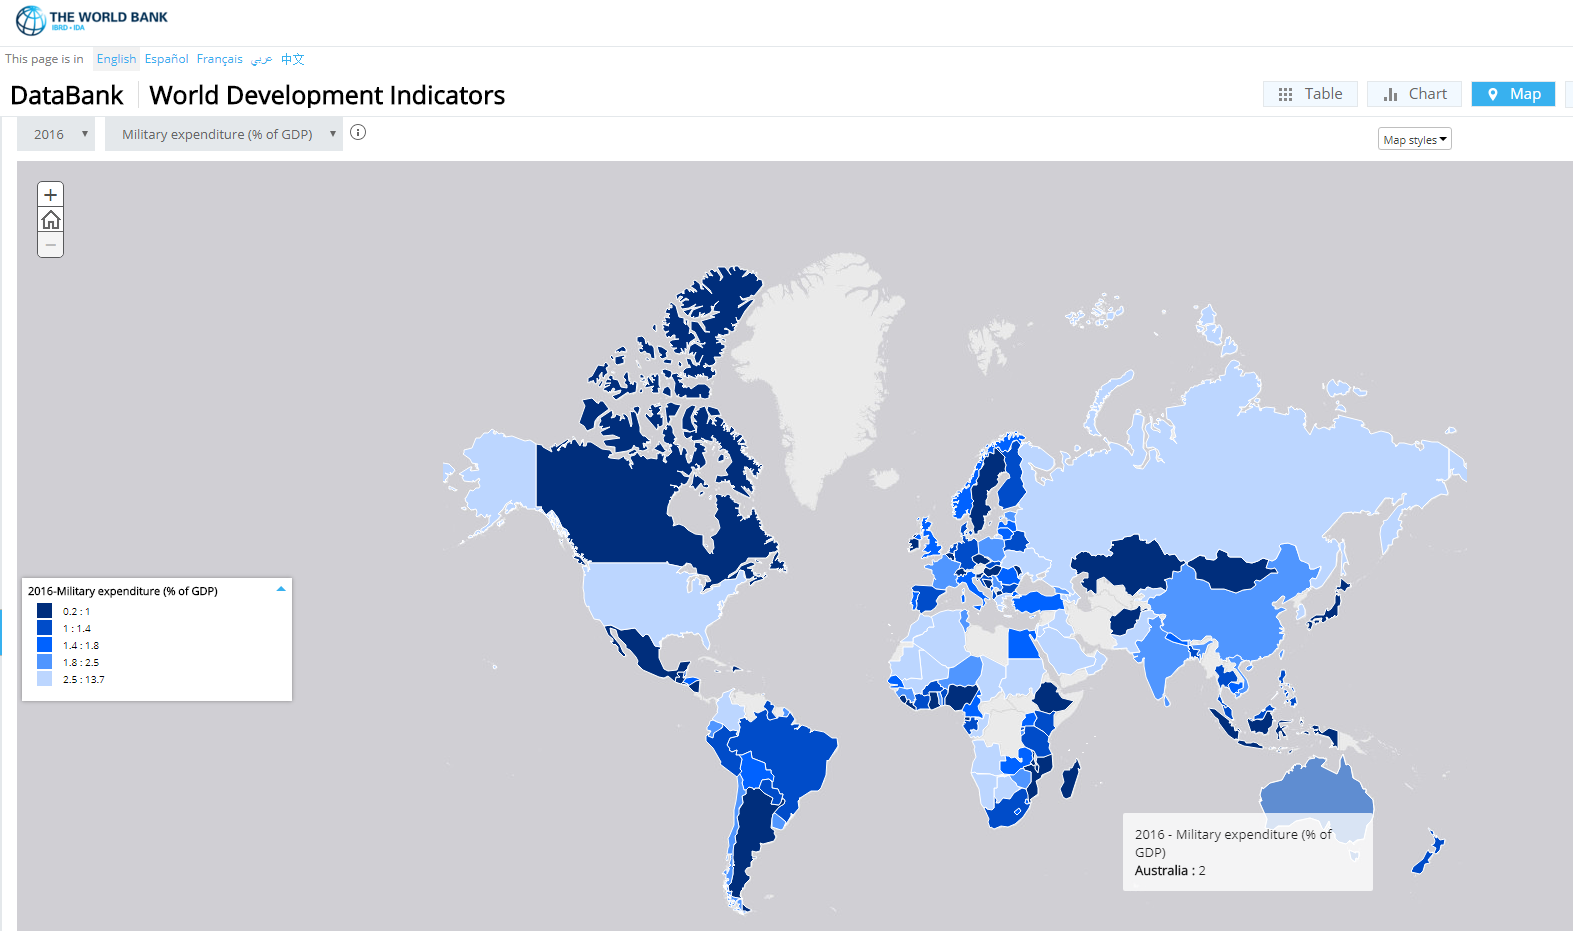
http://data.worldbank.org/indicator/MS.MIL.XPND.GD.ZS
http://www.globalfirepower.com/countries-comparison-detail.asp?form=form&country1=united-states-of-america&country2=russia&Submit=COMPARE
Military power comparison results for United States of America vs. Russia.


RESULTS
GFP Rank:
1 (of 106)
2 (of 106)
Total Population:
320,202,220
142,470,272
Manpower Available:
145,212,012
69,117,271
Fit-for-Service:
120,022,084
46,812,553
Reaching Military Age Annually:
4,217,412
1,354,202
Active Military Personnel:
1,400,000
766,055
Active Military Reserves:
1,100,000
2,485,000
Aircraft (All Types):
13,892
3,429
Helicopters:
6,196
1,120
Attack Helicopters:
920
462
Attack Aircraft (Fixed-Wing):
2,797
1,305
Fighter Aircraft:
2,207
769
Trainer Aircraft:
2,809
346
Transport Aircraft:
5,366
1,083
Serviceable Airports:
13,513
1,218
Tank Strength:
8,848
15,398
AFV Strength:
41,062
31,298
SPG Strength:
1,934
5,972
Towed Artillery:
1,299
4,625
MLRS Strength:
1,331
3,793
Merchant Marine Strength:
393
1,143
Major Ports / Terminals:
24
7
Fleet Strength:
473
352
Aircraft Carriers:
20
1
Submarines:
72
55
Frigates:
10
4
Destroyers:
62
12
Corvettes:
0
74
Mine Warfare Craft:
11
34
Patrol Craft:
13
65
External Debt (USD):
$15,680,000,000,000
$714,200,000,000
Annual Defense Budget (USD):
$577,100,000,000
$60,400,000,000
Reserves Foreign Exchange / Gold (USD):
$150,200,000,000
$515,600,000,000
Purchasing Power Parity:
$16,720,000,000,000
$2,553,000,000,000
Labor Force:
155,400,000
75,290,000
Oil Production (Barrels/Day):
7,441,200 bbl
10,580,000 bbl
Oil Consumption (Barrels/Day):
19,000,000 bbl
3,200,000 bbl
Proven Oil Reserves (Barrels/Day):
20,680,000,000 bbl
80,000,000,000 bbl
Roadway Coverage (km):
6,586,610 km
982,000 km
Railway Coverage (km):
224,792 km
87,157 km
Waterway Coverage (km):
41,009 km
102,000 km
Coastline Coverage (km):
19,924 km
37,653 km
Shared Borders (km):
12,048 km
22,407 km
Square Land Area (km):
9,826,675 km
17,098,242 km
Partial Sources: CIA.gov, CIA World Factbook, wikipedia.com, public domain print and media sources and user contributions. Some values may be estimated when official sources are lacking.
Update 30/9/2019 - Australia now world's second biggest weapons importer behind only Saudi Arabia:
Figures compiled by the renowned Stockholm International Peace Research Institute (SIPRI) show Australia last year jumped from being the fourth-highest weapons importer in 2017, to the world's second biggest military purchaser in 2018. In 2018, payments for expensive new aircraft such as Joint Strike Fighters as well as French work on the Future Submarine project are believed to have helped push Australia close to the top of global defence import rankings.
https://www.abc.net.au/news/2019-09-30/australia-worlds-second-biggest-weapons-importer-behind-saudi/11558762
No comments:
Post a Comment