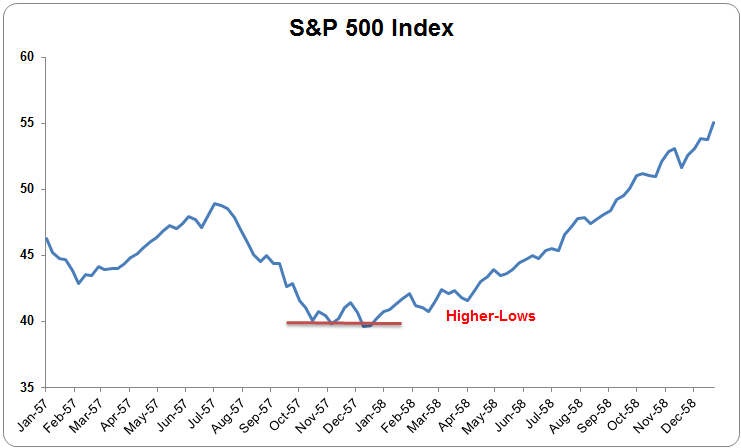
The U.S. government began to tighten monetary policy years prior to the recession in 1958, also known as the Eisenhower Recession, in an effort to curb inflation; however, prices continued to climb and the strengthening U.S. dollar led to a growing foreign trade deficit. Notice how the S&P 500 hit the same low point on three occasions before finally resuming its bull-run, giving patient investors several clues that new lower-lows would be highly unlikely as buyers began to step back in. The higher-lows seen from the start of 1958 confirmed the bottom.
The Crash of 1962
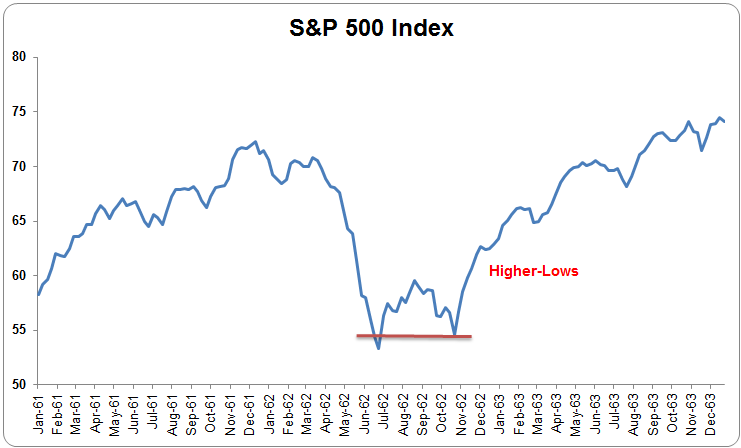
The expansionary period that followed the recession in 1960-61, which was a result of high unemployment and a shift to foreign-made cars, was met with another sharp decline as the Fed began to tighten monetary policy. Keen investors kept their eye on the critical support level (red line), which was confirmed after a double-bottom prior to the start of 1963; a sharp rally with higher-lows confirmed the bear market was very likely over.
Top
Bottom
Bear Return
Duration
Dec 12, 1961
Jun 26, 1962
-28.0%
6 Months
The Crash of 1966
Top
Bottom
Bear Return
Duration
Feb 9, 1966
Oct 7, 1966
-22.2%
8 Months
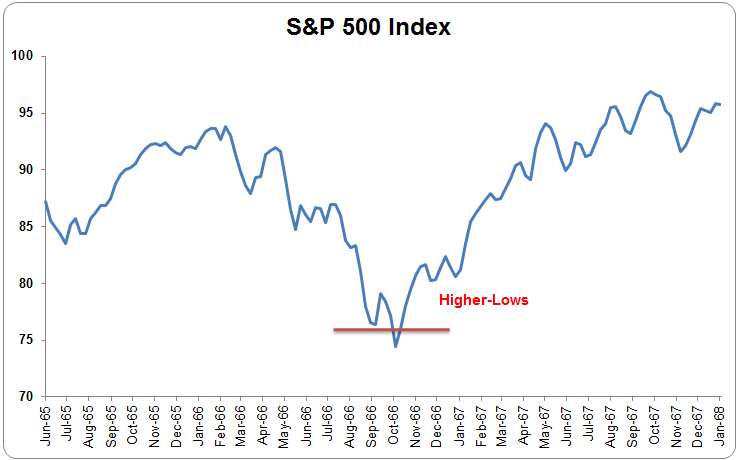
Many economists recognize the credit crush of 1966 as the first significant post-war financial crisis. Amid economic expansion at home, the Federal Reserve proceeded to tighten monetary policy so much that it threatened the profitability of financial institutions. Policymakers had to intervene to save the municipal bond market after a credit crunch ensued and confidence was restored; the S&P 500 Index proceeded to post higher-lows prior to the start of 1967.
The Crash of 1969-70
Top
Bottom
Bear Return
Duration
Nov 29, 1968
May 26, 1970
-36.1%
18 Months
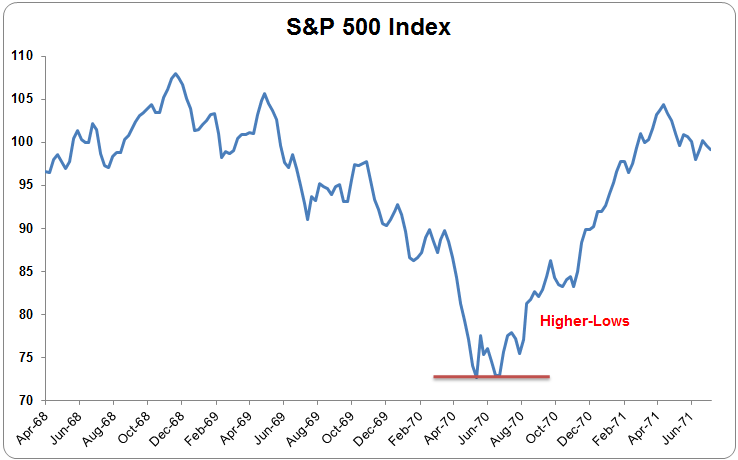
Rising inflation, increased deficits from the Vietnam War, and monetary tightening sent markets tumbling at the start of 1969. The economic recession at the time put a further damper on investors’ confidence and the S&P 500 endured a nasty losing stretch lasting well over a year and half, shedding upwards of 35% in that time frame. The market formed a double-bottom in the first half of 1970 and proceeded to resume its bull run with higher-lows in the months following.
The Crash of 1973-74
Top
Bottom
Bear Return
Duration
Jan 5, 1973
Oct 3, 1974
-48.4%
21 Months
The abandonment of the Bretton Woods system in 1971, which terminated the convertibility of the U.S. dollar to gold, sent financial markets around the globe into a tailspin, with the United Kingdom getting hit particularly hard. Adding to the turmoil, the OPEC oil embargo in 1973 sent crude prices higher, further hurting U.S. consumers who also battled with the devaluation of the U.S. dollar. The S&P 500 endured its worst and longest bear market to date and higher-lows in mid-1975 confirmed that the bottom was in.
The Crash of 1980-82
Top
Bottom
Bear Return
Duration
Nov 28, 1980
Aug 12, 1982
-27.1%
20 Months
A second oil crisis followed in 1979 in the wake of the Iranian Revolution, sending crude prices higher and hurting consumer spending. Lingering inflation from the 1970s also prompted the Federal Reserve to raise rates dramatically, which sparked the second longest bear market to date. By the start of 1973, inflation had been tamed to 3.2% and the S&P 500 Index had snapped back higher, confirming the bottom with higher-lows.
The Federal Reserve started raising rates in 1986 to combat inflation as equity markets had enjoyed a stellar run-up; tightened monetary policy at home was welcomed with a steep sell-off that became known as ‘Black Monday’ and led to stock market crashes around the globe, starting in Hong Kong and spreading to Europe. At the same time, Iran had fired on a U.S. oil-supertanker, which led to a conflict in the Persian Gulf that further deteriorated investors’ confidence in the markets. The S&P 500 endured its steepest three-month decline in history and proceeded to resume its bull run by the start of 1988.
The Dot-Com Bubble
Top
Bottom
Bear Return
Duration
Mar 24, 2000
Oct 9, 2002
-49.1%
31 Months
The ‘90s were characterized by exceptional economic expansion, brought on largely by the rampant growth and adoption of the Internet, which forever changed the world of business and entertainment. However, speculation over technology companies peaked and then coupled with the September 11th terrorist attacks to bring the period of growth to an end. The economic recession that ensued was short-lived, however, as the dot-com bubble’s impact was fairly contained to Wall Street. The S&P 500 carved out a triple-bottom in the second half of 2002 and confirmed this with higher-lows into mid-2003.
The Housing Bubble
Top
Bottom
Bear Return
Duration
Oct 9, 2007
Mar 9, 2009
-56.8%
17 Months
Speculative lending practices fueled a massive housing boom in the U.S. that inevitably led to the subprime mortgage crisis. The subsequent collapse in housing prices combined with rising oil and food costs to send the market crashing as investors pulled money out of Wall Street amid intensifying fears over the looming global financial meltdown. This remains the steepest bear market in the S&P 500’s history and contributed to what is regarded as the ‘Lost Decade’ in the U.S. stock market – the period spanning the dot-com and housing bubbles. The Federal Reserve rode to the rescue and bailed out a number of financial institutions, helping to restore confidence and bolstering equities sharply higher by mid-2009.


No comments:
Post a Comment