http://blog.zorangagic.com/2015/06/sydney-house-prices-to-income-ratio.html
Updated data from:
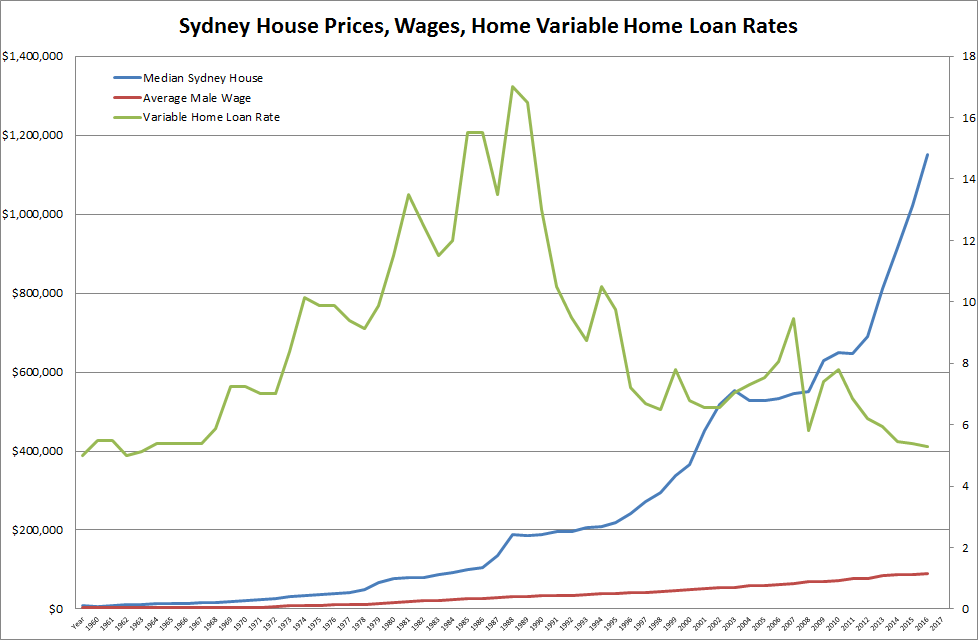
Sydney House Prices: https://www.domain.com.au/news/domain-property-reports/
Variable Home Loan Rates: http://www.rba.gov.au/statistics/tables/index.html (See F5)
Wages (based on male earning x 52 weeks): http://www.abs.gov.au/ausstats/abs@.nsf/mf/6302.0
Wages growth: http://www.abs.gov.au/ausstats/abs@.nsf/mf/6345.0
See spreadsheets here and here


Census makes it official: young Australians are priced out of home market:


We have had a major stock market crash every decade, see S&P 500 data below:
| Top | Bottom | Crash | Return Duration |
| Jul 15, 1957 | Oct 22, 1957 | -20.70% | 3 Months |
| Dec 12, 1961 | Jun 26, 1962 | -28.00% | 6 Months |
| Feb 9, 1966 | Oct 7, 1966 | 22.20% | 8 Months |
| Nov 29, 1968 | May 26, 1970 | 36.10% | 18 Months |
| Jan 5, 1973 | Oct 3, 1974 | -48.40% | 21 Months |
| Nov 28, 1980 | Aug 12, 1982 | -27.10% | 20 Months |
| Aug 25, 1987 | Dec 4, 1987 | -33.50% | 3 Months |
| Mar 24, 2000 | Oct 9, 2002 | -49.10% | 31 Months |
| Oct 9, 2007 | Mar 9, 2009 | -56.80% | 17 Months |
Data:
| Year | Median Sydney House | Wage | Ratio | Variable Home Loan Rate | Deposit (30% of median) | Mortgage Amount | Monthly Mortgage | Mortgage as percent of Wage |
| 1960 | $9,500 | $2,923 | 3.3 | 5 | $2,850 | $6,650 | $38.88 | 15.96% |
| 1961 | $7,500 | $2,998 | 2.5 | 5.5 | $2,250 | $5,250 | $32.24 | 12.90% |
| 1962 | $9,240 | $2,992 | 3.1 | 5.5 | $2,772 | $6,468 | $39.72 | 15.93% |
| 1963 | $11,390 | $3,003 | 3.8 | 5 | $3,417 | $7,973 | $46.61 | 18.63% |
| 1964 | $12,030 | $3,079 | 3.9 | 5.13 | $3,609 | $8,421 | $49.87 | 19.44% |
| 1965 | $12,700 | $3,193 | 4 | 5.38 | $3,810 | $8,890 | $53.96 | 20.28% |
| 1966 | $13,310 | $3,370 | 4 | 5.38 | $3,993 | $9,317 | $56.55 | 20.14% |
| 1967 | $13,950 | $3,598 | 3.9 | 5.38 | $4,185 | $9,765 | $59.27 | 19.77% |
| 1968 | $15,120 | $3,812 | 4 | 5.38 | $4,536 | $10,584 | $64.24 | 20.22% |
| 1969 | $16,380 | $4,160 | 3.9 | 5.88 | $4,914 | $11,466 | $73.04 | 21.07% |
| 1970 | $17,750 | $4,200 | 4.2 | 7.25 | $5,325 | $12,425 | $89.81 | 25.66% |
| 1971 | $20,990 | $4,482 | 4.7 | 7.25 | $6,297 | $14,693 | $106.20 | 28.43% |
| 1972 | $23,460 | $4,623 | 5.1 | 7 | $7,038 | $16,422 | $116.07 | 30.13% |
| 1973 | $27,130 | $6,136 | 4.4 | 7 | $8,139 | $18,991 | $134.22 | 26.25% |
| 1974 | $31,480 | $7,686 | 4.1 | 8.38 | $9,444 | $22,036 | $175.66 | 27.43% |
| 1975 | $33,960 | $8,866 | 3.8 | 10.13 | $10,188 | $23,772 | $218.20 | 29.53% |
| 1976 | $36,430 | $9,937 | 3.7 | 9.88 | $10,929 | $25,501 | $229.57 | 27.72% |
| 1977 | $38,810 | $10,884 | 3.6 | 9.88 | $11,643 | $27,167 | $244.57 | 26.96% |
| 1978 | $42,770 | $11,783 | 3.6 | 9.38 | $12,831 | $29,939 | $259.08 | 26.39% |
| 1979 | $50,190 | $12,241 | 4.1 | 9.13 | $15,057 | $35,133 | $297.97 | 29.21% |
| 1980 | $68,160 | $13,458 | 5.1 | 9.88 | $20,448 | $47,712 | $429.53 | 38.30% |
| 1981 | $78,110 | $16,786 | 4.7 | 11.5 | $23,433 | $54,677 | $555.77 | 39.73% |
| 1982 | $78,630 | $19,256 | 4.1 | 13.5 | $23,589 | $55,041 | $641.58 | 39.98% |
| 1983 | $80,610 | $20,493 | 3.9 | 12.5 | $24,183 | $56,427 | $615.25 | 36.03% |
| 1984 | $87,470 | $22,220 | 3.9 | 11.5 | $26,241 | $61,229 | $622.37 | 33.61% |
| 1985 | $91,280 | $23,587 | 3.9 | 12 | $27,384 | $63,896 | $672.97 | 34.24% |
| 1986 | $99,280 | $25,407 | 3.9 | 15.5 | $29,784 | $69,496 | $917.17 | 43.32% |
| 1987 | $104,660 | $26,910 | 3.9 | 15.5 | $31,398 | $73,262 | $966.87 | 43.12% |
| 1988 | $136,390 | $29,063 | 4.7 | 13.5 | $40,917 | $95,473 | $1,112.88 | 45.95% |
| 1989 | $188,900 | $30,987 | 6.1 | 17 | $56,670 | $132,230 | $1,901.20 | 73.63% |
| 1990 | $185,750 | $31,200 | 6 | 16.5 | $55,725 | $130,025 | $1,818.07 | 69.93% |
| 1991 | $189,090 | $34,018 | 5.6 | 13 | $56,727 | $132,363 | $1,492.84 | 52.66% |
| 1992 | $196,320 | $34,575 | 5.7 | 10.5 | $58,896 | $137,424 | $1,297.53 | 45.03% |
| 1993 | $197,250 | $35,360 | 5.6 | 9.5 | $59,175 | $138,075 | $1,206.36 | 40.94% |
| 1994 | $206,720 | $36,161 | 5.7 | 8.75 | $62,016 | $144,704 | $1,189.67 | 39.48% |
| 1995 | $210,060 | $38,631 | 5.4 | 10.5 | $63,018 | $147,042 | $1,388.34 | 43.13% |
| 1996 | $220,000 | $39,681 | 5.5 | 9.75 | $66,000 | $154,000 | $1,372.35 | 41.50% |
| 1997 | $241,000 | $41,028 | 5.9 | 7.2 | $72,300 | $168,700 | $1,213.95 | 35.51% |
| 1998 | $272,000 | $42,546 | 6.4 | 6.7 | $81,600 | $190,400 | $1,309.49 | 36.93% |
| 1999 | $296,000 | $44,704 | 6.6 | 6.5 | $88,800 | $207,200 | $1,399.03 | 37.55% |
| 2000 | $337,000 | $46,847 | 7.2 | 7.8 | $101,100 | $235,900 | $1,789.57 | 45.84% |
| 2001 | $365,000 | $49,915 | 7.3 | 6.8 | $109,500 | $255,500 | $1,773.35 | 42.63% |
| 2002 | $452,000 | $51,901 | 8.7 | 6.55 | $135,600 | $316,400 | $2,146.25 | 49.62% |
| 2003 | $519,000 | $53,524 | 9.7 | 6.55 | $155,700 | $363,300 | $2,464.39 | 55.25% |
| 2004 | $552,000 | $54,548 | 10.1 | 7.05 | $165,600 | $386,400 | $2,743.33 | 60.35% |
| 2005 | $528,000 | $58,781 | 9 | 7.3 | $158,400 | $369,600 | $2,683.41 | 54.78% |
| 2006 | $526,800 | $59,608 | 8.8 | 7.55 | $158,040 | $368,760 | $2,737.11 | 55.10% |
| 2007 | $532,600 | $62,384 | 8.5 | 8.05 | $159,780 | $372,820 | $2,889.84 | 55.59% |
| 2008 | $546,000 | $65,036 | 8.4 | 9.45 | $163,800 | $382,200 | $3,325.99 | 61.37% |
| 2009 | $551,200 | $68,775 | 8 | 5.8 | $165,360 | $385,840 | $2,439.02 | 42.56% |
| 2010 | $629,900 | $70,361 | 9 | 7.4 | $188,970 | $440,930 | $3,229.81 | 55.08% |
| 2011 | $649,000 | $72,238 | 9 | 7.8 | $194,700 | $454,300 | $3,446.39 | 57.25% |
| 2012 | $646,700 | $77,298 | 8.4 | 6.85 | $194,010 | $452,690 | $3,156.33 | 49.00% |
| 2013 | $690,400 | $77,964 | 8.9 | 6.2 | $207,120 | $483,280 | $3,173.13 | 48.84% |
| 2014 | $811,000 | $83,819 | 9.7 | 5.95 | $243,300 | $567,700 | $3,640.37 | 52.12% |
| 2015 | $916,430 | $86,752 | 10.6 | 5.45 | $274,929 | $641,501 | $3,920.25 | 54.23% |
| 2016 | $1,021,968 | $88,114 | 11.6 | 5.4 | $306,590 | $715,378 | $4,350.43 | 59.25% |
| 2017 | $1,151,565 | $89,788 | 12.8 | 5.3 | $345,470 | $806,096 | $4,854.32 | 64.88% |
Here are some real estate ads from 1972:


No comments:
Post a Comment